If you’re building custom tools or automations in Adobe After Effects, you’ve likely worked with ExtendScript (Adobe’s scripting language, based on JavaScript ES3) or its modern successor, the After Effects API with UXP/JavaScript. Writing scripts can streamline your workflow, but debugging them isn’t always straightforward. That’s where breakpoints come in.
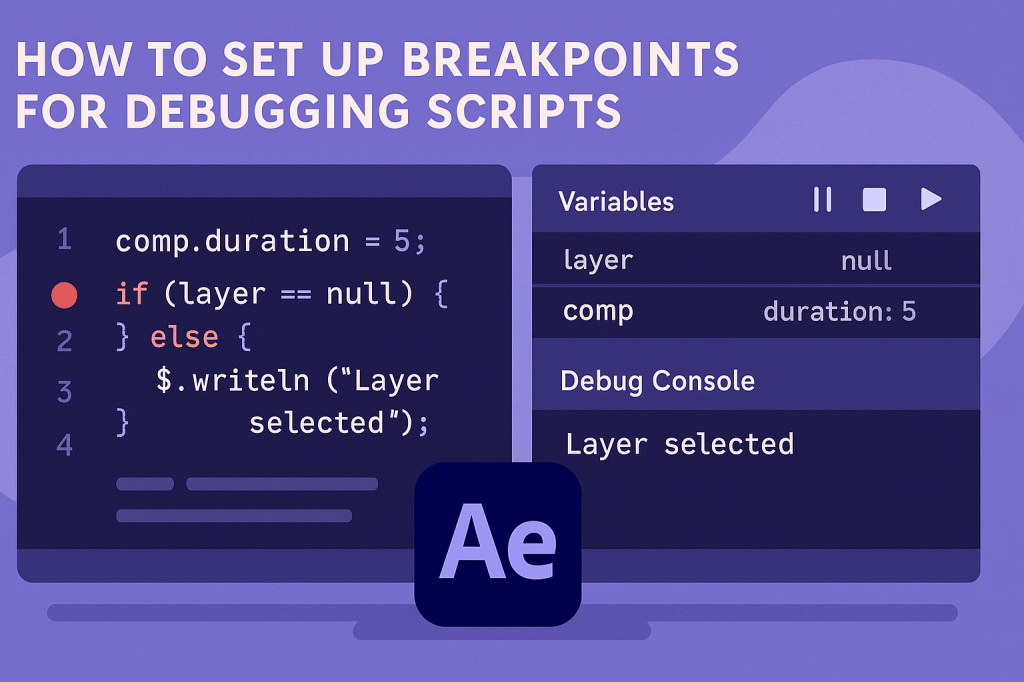
Breakpoints allow you to pause script execution at specific points so you can inspect variables, step through logic, and catch errors before they crash your workflow.
🎬 Why Use Breakpoints in After Effects Scripts?
- Catch errors early (before they cause unexpected results).
- Inspect variable values at runtime.
- Step through logic line by line instead of guessing what went wrong.
- Optimize performance by seeing where scripts slow down.
⚡ Option 1: Debugging with ExtendScript Toolkit (Legacy)
For older workflows (CS6 – CC 2019), Adobe provided the ExtendScript Toolkit (ESTK), which still works for many scripting setups.
- Open ExtendScript Toolkit (ships with older Adobe apps).
- Open your
.jsxscript. - In the editor, click the gutter (left margin) next to a line number to set a breakpoint.
- From the dropdown in ESTK, choose Target: After Effects.
- Run the script — After Effects executes it but pauses at your breakpoint.
- Use:
- Step Into (F11)
- Step Over (F10)
- Step Out (Shift+F11)
- Data Browser to inspect variable values.
👉 Note: ESTK is deprecated but still used in some legacy pipelines.
⚡ Option 2: Debugging with VS Code + ExtendScript Debugger
For modern setups, many developers use Visual Studio Code with the ExtendScript Debugger extension.
- Install Visual Studio Code.
- Install the extension: Adobe ExtendScript Debugger.
- Configure a
launch.jsonfile:
{
  "version": "0.2.0",
  "configurations": [
    {
      "type": "extendscript-debug",
      "request": "launch",
      "name": "Debug AE Script",
      "program": "${file}",
      "stopOnEntry": false,
      "targetSpecifier": "aftereffects-22.0"
    }
  ]
}
- Open your script (
.jsx). - Set breakpoints in VS Code by clicking the left margin.
- Press F5 to start debugging.
- The script will pause at breakpoints — use the Debug Console to inspect variables.
⚡ Option 3: Debugging UXP/JavaScript Panels
For modern AE UXP plugins/panels, debugging uses Chrome DevTools:
- Launch After Effects with your UXP panel loaded.
- Press Ctrl+Alt+Shift+D (Win) / Cmd+Opt+Shift+D (Mac) to open DevTools.
- Set breakpoints directly in the DevTools editor.
- Refresh your panel and run the script.
- Use the debugger to inspect variables, watch expressions, and step through code.
👉 UXP debugging is more powerful than ESTK, as it uses modern JavaScript (ES6+).
🛠️ Pro Tips
- Use
$.writeln()(ExtendScript) orconsole.log()(UXP) to log values alongside breakpoints. - Group breakpoints around conditionals and loops to catch logic errors.
- Check for undefined layers/objects — one of the most common causes of script crashes in AE.
- Use conditional breakpoints (right-click a breakpoint → set condition) for efficiency.
🎯 Final Thoughts
Breakpoints are essential for serious After Effects scripting. Whether you’re using ExtendScript Toolkit, VS Code with ExtendScript Debugger, or UXP with Chrome DevTools, breakpoints give you full control over execution and help eliminate guesswork.
👉 Want to try scripting? Download Adobe After Effects free trial and start building custom tools today.